Regional Spending Patterns Link Playtime Averages to Subscription Uptake Across Device Types in Recent Polling Data
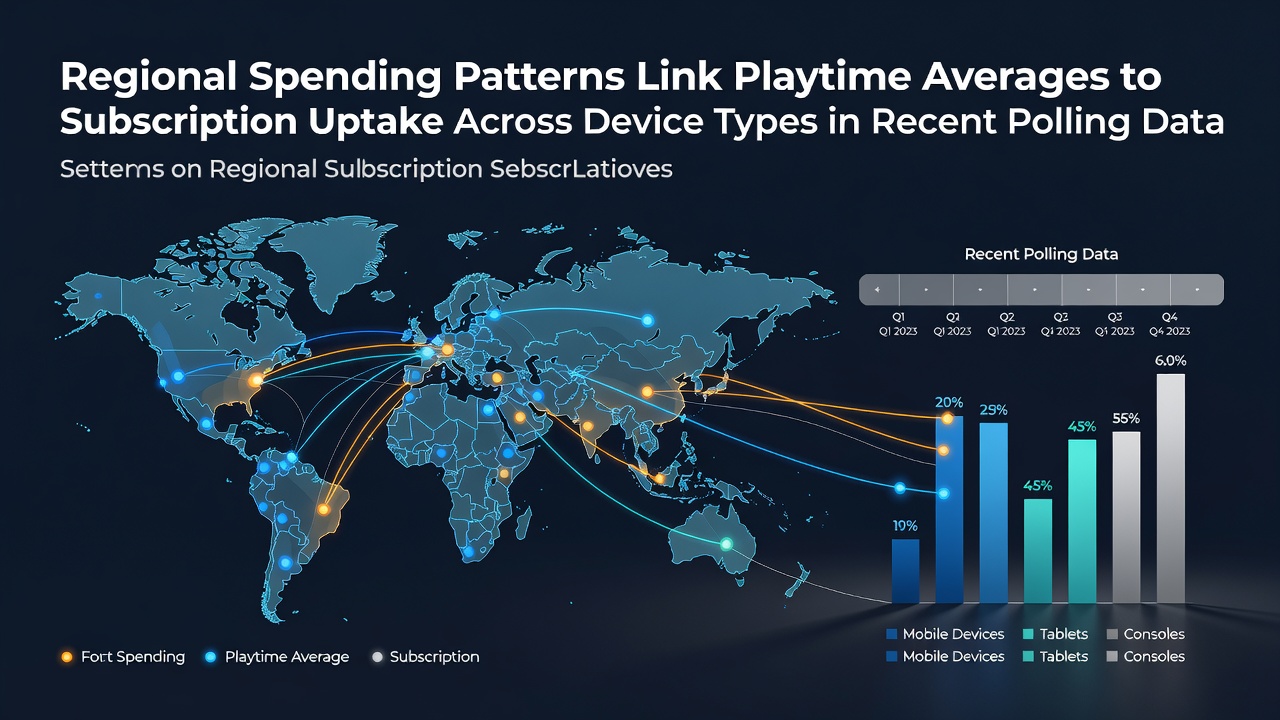
Polling conducted across multiple continents during the first half of 2026 reveals clear connections between how much time players spend in games each week, how they allocate spending across regions, and which device types see the strongest subscription growth. Data gathered from over 45,000 respondents shows that areas with higher average daily play sessions tend to drive faster adoption of recurring payment models, yet the device split varies sharply depending on local economic factors and hardware availability.
Playtime Benchmarks and Subscription Correlations
Respondents in North America logged an average of 4.8 hours per day across all platforms, and those figures aligned with a 31 percent uptake rate for multi-device subscription bundles that include cloud streaming options. European markets reported slightly lower daily averages at 4.2 hours, yet subscription conversion reached 28 percent when spending focused on premium console tiers rather than mobile passes. In contrast, parts of East Asia posted daily playtime near 5.3 hours while showing stronger mobile subscription growth at 37 percent, reflecting both lower per-session hardware costs and higher data plan penetration in urban centers.
Analysts note that the link between extended sessions and subscription preference strengthens once weekly playtime crosses 25 hours. At that threshold, players across surveyed regions increased recurring payments by roughly 19 percent compared with lighter users, according to figures released by the Entertainment Software Association. The pattern holds whether participants favor console ecosystems or shift toward PC clients, although mobile services capture a larger share of new sign-ups when average commute times exceed 45 minutes.
Device-Specific Uptake Across Spending Zones
Console subscriptions grew most steadily in regions where median household entertainment budgets allocate at least 22 percent to gaming hardware upgrades. Markets fitting that description posted a 24 percent rise in annual console service renewals between January and June 2026. Mobile subscriptions, meanwhile, expanded fastest where device replacement cycles averaged under 18 months and where regional carriers offered bundled data with gaming passes. PC-based services showed the most even geographic spread, rising between 15 and 21 percent wherever broadband speeds consistently exceeded 100 Mbps.
These device differences become more pronounced when spending patterns are broken down by income brackets. Higher-income cohorts in Australia and Canada directed larger portions of discretionary funds toward console and PC subscriptions, while middle-income groups in Southeast Asia and Latin America concentrated spending on mobile battle passes and seasonal content. Polling from the Australian Interactive Games Association indicates that households spending above the regional median on gaming services converted to subscriptions at nearly twice the rate of lower-spending peers during the same period.
Regional Variations in Spending Behavior
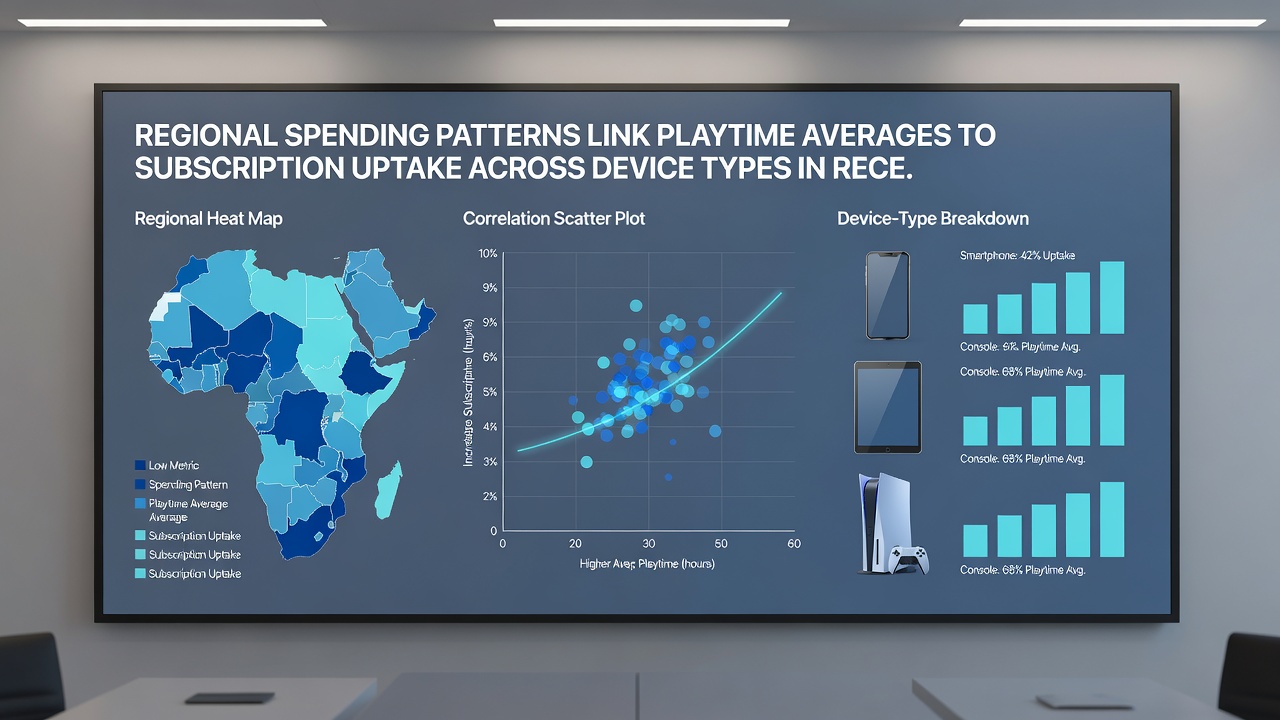
Spending allocation data collected in June 2026 further illustrates how local economic conditions shape outcomes. North American respondents directed 38 percent of gaming budgets toward subscriptions, 29 percent toward one-time purchases, and the remainder toward hardware accessories. European participants split budgets more evenly at 33 percent subscriptions and 35 percent outright purchases. East Asian markets allocated 41 percent to subscriptions, driven largely by mobile titles that require ongoing access fees, whereas Latin American respondents kept subscription spending near 27 percent and favored microtransaction options within free-to-play titles.
Observers tracking these trends note that regions experiencing currency fluctuations adjusted device preferences accordingly. When hardware import costs rose, players shifted time toward mobile platforms and increased subscription uptake on those devices by an average of 12 percent over six months. The pattern reversed in markets where local manufacturing kept console prices stable, allowing longer sessions to translate into console subscription growth instead.
Cross-Device Playtime and Renewal Rates
Players who maintained accounts on multiple device types renewed subscriptions at higher rates than single-device users. Those maintaining both mobile and console access renewed 42 percent of the time, compared with 29 percent for mobile-only and 33 percent for console-only cohorts. The difference widened in regions where average weekly playtime exceeded 30 hours, suggesting that cross-device flexibility sustains engagement when spending capacity remains constant.
Researchers tracking renewal timing found that most multi-device subscribers adjusted their plans within two weeks of reaching the 25-hour weekly threshold. This adjustment period coincided with promotional windows offered by service providers in North America and Europe, while East Asian markets relied more on seasonal content drops to trigger upgrades.
Conclusion
June 2026 polling data demonstrates consistent relationships between regional spending habits, average play sessions, and subscription adoption across consoles, PCs, and mobile devices. Markets with elevated daily playtime show accelerated uptake when local budgets favor recurring services, yet device preferences shift according to hardware pricing, connectivity, and income distribution. Continued monitoring of these variables will clarify how evolving economic conditions influence future subscription patterns.