Mapping Expenditure Flows Against Hours Spent in Virtual Environments Across Various Hardware Platforms
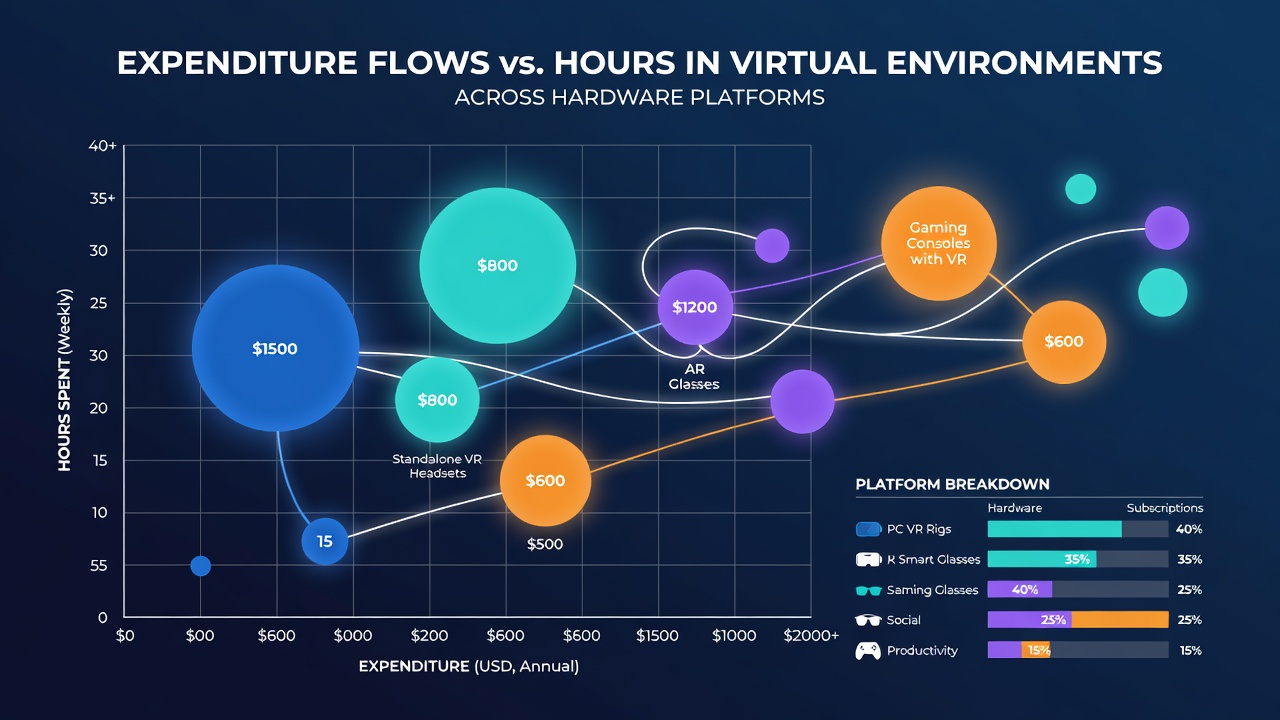
Survey data collected through mid-2026 shows clear patterns when researchers align player spending with time logged inside virtual spaces, and these patterns shift noticeably depending on whether users engage through PCs, consoles, mobile devices, or dedicated VR systems. Analysts at industry research firms compile transaction records alongside self-reported play logs to trace how dollars move in relation to hours accumulated, revealing that hardware type influences both the pace of spending and the total duration users remain active.
Platform-Specific Time and Spending Distributions
PC users record the highest average weekly hours in virtual environments, often exceeding 18 hours according to aggregated telemetry from multiple tracking services, while their expenditure per hour stays moderate because many titles rely on one-time purchases or subscription models rather than frequent microtransactions. Console players follow closely behind with roughly 14 hours per week on average, yet spending clusters around seasonal releases and battle pass cycles that coincide with extended play streaks during holiday periods. Mobile sessions break into shorter bursts that total about 9 hours weekly, but expenditure per hour climbs higher as users respond to limited-time offers and in-app bundles that appear during brief login windows.
VR headset owners present a distinct profile where total hours remain lower, averaging 6 hours weekly, because physical demands and setup requirements limit sustained play, while hardware costs plus premium content purchases create elevated upfront expenditure that researchers map against those constrained session lengths. Data released in June 2026 from cross-platform panels indicate VR spend concentrates in the first three months after device acquisition, after which outlays drop sharply even as some users maintain consistent though brief return visits.
Regional Variations in Expenditure Mapping
North American and European datasets show similar hour-to-spend ratios on consoles, yet mobile expenditure accelerates faster in Asian markets where free-to-play titles dominate and users convert time into smaller, repeated purchases. Statistics Canada reports released in spring 2026 track these flows across device categories and confirm that Canadian console households allocate higher absolute dollars per hour than mobile-only users, while Australian Interactive Games Association figures reveal parallel trends with slightly elevated VR adoption correlating to concentrated early spending.
Hardware Lifecycle and Spending Velocity
Longer device ownership correlates with slower spending velocity across all platforms, as initial hardware investment gives way to content-focused outlays that researchers measure against cumulative hours. Those who keep the same PC build for multiple years show steadier subscription renewals spread across extended play periods, whereas console owners who upgrade every generation exhibit spending spikes tied to new hardware launches followed by normalized content purchases once hours stabilize.
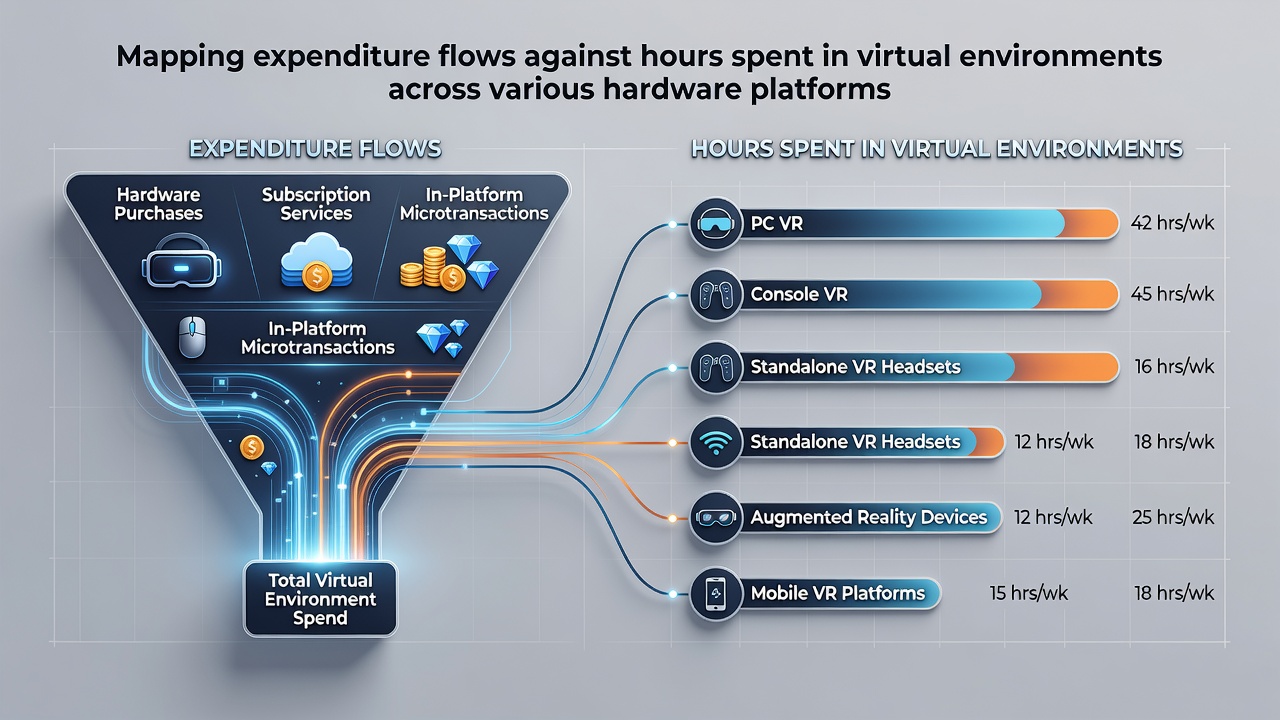
Observers tracking these mappings note that mobile platforms generate the steepest early expenditure curves relative to hours because push notifications and daily login rewards encourage quick transactions before total playtime accumulates substantially. In contrast, PC environments allow users to reach higher cumulative hours before significant additional spending occurs, often because modding communities and free updates extend engagement without immediate financial outlay. VR spending remains front-loaded regardless of region, with most documented purchases occurring within the first 90 days and subsequent hours logged against minimal new expenditure.
Subscription Models and Recurring Flows
Subscription services alter the expenditure-to-hours equation by converting one-time payments into steady monthly outlays that researchers divide across logged virtual time. Console subscribers maintain higher average hours than non-subscribers within the same hardware category, yet the per-hour cost decreases once the subscription fee is amortized over multiple titles. Mobile subscription uptake shows weaker correlation to total hours, as many users toggle services on and off based on specific game events rather than continuous engagement.
Industry organizations such as the Entertainment Software Association compile these subscription-linked mappings and report that PC users who maintain multiple simultaneous subscriptions accumulate the greatest total hours while keeping effective per-hour costs lower than single-platform subscribers on consoles. VR subscription models remain limited, so expenditure stays tied more directly to individual content purchases rather than recurring service fees.
Conclusion
Comprehensive mapping of expenditure against virtual hours demonstrates that hardware choice shapes both the volume of time invested and the timing of financial commitments, with mobile driving frequent small transactions, PC supporting extended low-velocity spending, consoles balancing seasonal peaks, and VR concentrating costs early in the ownership cycle. June 2026 datasets continue to refine these mappings as new hardware releases and regional policy changes influence how players allocate both time and money across virtual environments.